---
title: Introduction to Analytics & Insights
description: The first page you enter in the control panel is an account summary of the past 60 days. Here, you can see some of the main KPIs and metrics of your combined solution. The account summary is great f
---
[Skip to content](https://content.raptorservices.com/help-center/introduction-to-analytics-and-insights#main-content)
![raptor-qntm-logo\_horizontal\_gradient.png\]](https://content.raptorservices.com/hs-fs/hubfs/raptor-qntm-logo_horizontal_gradient.png?height=40&name=raptor-qntm-logo_horizontal_gradient.png)
Open main navigation
Close main navigation
- [Go to raptorservices.com](https://raptorservices.com/)
[Go to raptorservices.com](https://raptorservices.com/)
Hello. How can we help you?
- There are no suggestions because the search field is empty.
1. [Help Center](https://content.raptorservices.com/help-center?hsLang=en)
2. [Analytics & Insights](https://content.raptorservices.com/help-center/analytics-insights?hsLang=en)
# Introduction to Analytics & Insights
Analytics & Insights is the main entry point for monitoring the performance of your Raptor-powered recommendations across the channels you have activated. It is designed to give business users, marketers and merchandisers a fast, at-a-glance overview of how Raptor's recommendation modules are contributing to revenue, engagement and customer behaviour on your website and in your e-mails on each of your markets separately and collectively across your markets. At the same time you can monitor how many E-mail Triggers are sent, and how many tracking events are received by Raptor through the tracking script.
Every metric is computed automatically from the tracking data that Raptor receives from your site, so the figures always reflect your most recent visitor and order activity.
This guide walks through every element of the three views, **Account Dashboard, Group Dashboard and Tracking Stats**, explains exactly how each number is calculated, and offers practical tips on how to interpret what you see so that you can make confident, data-driven decisions about your personalisation strategy.
### Account Dashboard & Group Dashboard
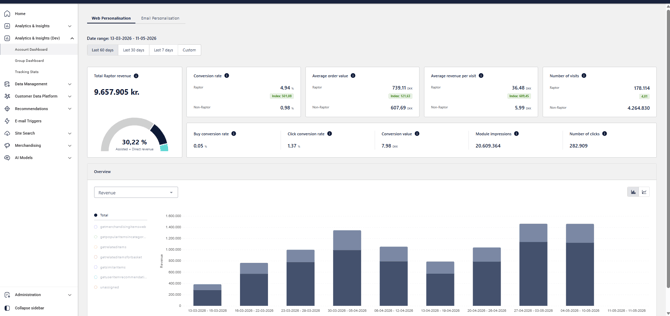
The Account Dashboard and the Group Dashboard contain the same metrics. The only difference is that **the Group Dashboard will aggregate all numbers across your markets/accounts, and the Account Dashboard shows the numbers for the active account.**
### Select a time-range
**Last 60 days, Last 30 days, Last 7 days** are shortcuts for the most commonly used reporting windows. Clicking one immediately updates the dashboard and all metrics to that rolling period, counted backwards from today. The currently active shortcut is highlighted, and the start and the end date are defined above.
**Custom** opens a calendar where you can pick any start and end date. Use it for ad-hoc reporting such as a campaign window, a specific month, or a year-over-year comparison.
### Web Personalisation tab
The five cards in the top row, and the second strip of five smaller KPIs, together summarise the commercial impact of Raptor on your site. Each metric is presented for two visitor groups so that you can compare them directly:
- **Raptor** — visits, purchases or sessions in which the user interacted with (clicked) a Raptor recommendation module.
- **Non-Raptor** — visits, purchases or sessions in which the user did *not* interact with a Raptor module.
The green **Index** chip shown under several KPIs expresses how much better the Raptor visitors performs than the Non-Raptor visitors. An index of 100 means parity; an index of 500 means the Raptor visitors perform 5× better on that metric. It is the quickest way to quantify the uplift Raptor is delivering.
A red index chip with a number below 100 indicates a worse performance by Raptor visitors than Non-Raptor visitors.
### Performance per module
Selecting a module in the drop down to the right of the date picker allows you to drill down in the performance numbers module by module in the selected period. The modules are grouped into two types:
- Revenue modules: Product recommendation modules that contribute to your online revenue. Available metrics are Total Raptor revenue, Buy conversion rate, Click conversion rate, Conversion rate, Module impressions, and Number of clicks.
- Non-revenue modules: These are typically content modules, and available metrics for these are Module impressions and Number of clicks.
By default, you will see performance numbers for all modules. By clicking the group headers, you will see the metrics aggregated for the group.
### Total Raptor revenue
The total monetary value (in your account currency) that Raptor recommendations are credited with during the selected period. The doughnut underneath the figure visualises the split between **Assisted + Direct revenue**, i.e. the share of total revenue attributable to Raptor:
- **Direct Raptor revenue** — the sum of revenue from orders where the user clicked a product in a Raptor recommendation module and subsequently purchased that same product.
- **Assisted Raptor revenue** — the sum of revenue from orders where the user clicked a product in a Raptor recommendation module and purchased a different product.
**🔍 Note:** The **attribution period is seven days**. This means that when a user clicks a product in a recommendation module and makes a purchase within a seven days period, the purchase is attributed either as direct or indirect Raptor revenue
The big percentage is the share that Direct + Assisted Raptor revenue represents of total site revenue in the period.
### Conversion rate
Measures how often a visit ends in a purchase, split into two definitions:
- **Raptor** — number of visits with Raptor interaction that ended in a purchase, divided by the number of visits with Raptor interaction.
- **Non-Raptor** — number of visits without Raptor interaction that ended in a purchase, divided by the number of visits without Raptor interaction.
The Index chip compares the two: a value above 100 means visitors who engage with Raptor convert more often than those who don't.
### Average order value
Average value of an order, again split by Raptor interaction:
- **Raptor** — total revenue of purchases with Raptor interaction divided by the number of purchases with Raptor interaction.
- **Non-Raptor** — total revenue of purchases without Raptor interaction divided by the number of purchases without Raptor interaction.
The Index quantifies how much bigger a basket becomes when a user engages with a recommendation.
### Average revenue per visit
**Conversion rate × Average order value.** This combined KPI is a single, comparable number that captures both the propensity to buy and the size of the resulting basket. It is particularly useful for measuring overall commercial efficiency per visitor.
### Number of visits
- **Raptor** — number of visits in which the user clicked a product in a recommendation module.
- **Non-Raptor** — number of visits in which the user did *not* click a product in a recommendation module.
The Index shows the relative size of the two audiences. Together with the conversion rate, it puts the revenue contribution into perspective: even a small audience can have outsized impact.
### Buy conversion rate
Number of direct Raptor purchases divided by the number of module impressions. Whereas the top-card conversion rate is measured per visit, the buy conversion rate is measured *per recommendation shown*. It tells you how efficient an individual recommendation impression is at producing a purchase.
### Click conversion rate
Number of clicks in recommendation modules divided by the number of module impressions. This is the click-through rate (CTR) of your Raptor modules — a direct measure of how attractive and relevant the displayed items are to visitors.
### Conversion value
Direct Raptor revenue divided by the number of clicks in recommendation modules. In other words: the average amount of money each click on a Raptor recommendation is worth. It is a key metric for comparing the monetary quality of different modules or placements.
### Module impressions
The number of times a recommendation module has been shown — i.e. the number of times the Raptor API has been called and successfully returned recommendations that were rendered on the page. It is the denominator for both the Buy conversion rate and the Click conversion rate.
### Number of clicks
The total number of clicks visitors have made on items inside Raptor recommendation modules during the selected period. It is a pure engagement metric and the denominator of the Conversion value KPI.
**Tip:** Information icons (ⓘ) next to each KPI title open a short in-product tooltip with the same definitions used in this guide. Use them whenever you need a quick reminder.
### Overview chart
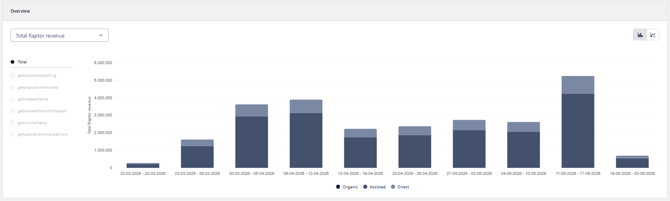
The Overview panel below the KPI cards shows how the selected metric has evolved over the chosen date range. It helps you spot trends, seasonality and the effect of campaigns or site changes that the top KPIs cannot reveal on their own.
### Metric selector
The dropdown on the upper-left of the chart switches the metric plotted on the y-axis. Available options are:
- **Average order value** — Average order value over time
- **Average revenue per visit** — Average revenue per visit over time
- **Buy conversion rate** — How many percent of impressions end in a direct Raptor sale over time.
- **Click conversion rate** — How many percent of visits end in a click in a recommendation module over time.
- **Conversion rate** — conversion rate over time.
- **Conversion value** — average value of a click in a recommendation module over time.
- **Module impressions** — how often recommendation modules were rendered over time.
- **Number of clicks** — clicks on recommended items over time.
- **Number of visits** — visits over time.
- **Total Raptor revenue** (default) — total Raptor-attributed revenue per period bucket, split into *Organic*, *Assisted* and *Direct* contributions (see the legend at the bottom of the chart).
### Chart-type toggle
The two icons  in the top-right of the chart toggle between a **bar chart** and a **line chart**. Bars are best for comparing discrete buckets (weeks, months); lines are best for spotting trends and inflection points.
### Module drill down
The legend on the left lists every recommendation module configured on your site. Clicking a module name toggles its series on or off in the chart so that you can isolate or compare specific modules. **Total** at the top of the list represents the sum across all modules. It is possible to **compare up to three modules** at once. Module drill down is not applicable in the Group Dashboard.
### Time axis
The x-axis shows the time buckets covered by your date range. Raptor automatically chooses an appropriate bucket size (day, week or month) based on the length of the selected range, so the chart stays readable even for long periods. Here is how it is divided:
Below 32 days = daily display
Between 32 and 90 days = weekly display
Above 90 days= monthly display
### Stacked colour bands (Organic / Assisted / Direct)
When the metric is **Total Raptor Revenue**, each bar is stacked into three coloured segments:
- **Organic** — revenue from visits where Raptor was shown but not interacted with. It approximates the baseline you would have earned without personalisation.
- **Assisted** — revenue from orders where the visitor clicked a Raptor recommendation but ultimately purchased a different product.
- **Direct** — revenue from orders where the visitor clicked a Raptor recommendation and purchased that very product.
Together *Assisted + Direct* equals the Raptor-attributed revenue shown in the Total Raptor revenue KPI.
### **E-mail Personalisation tab**
The Email Personalisation tab follows the same layout but is scoped to recommendations that have been rendered inside e-mails. Because the data flow for e-mails is different from web sessions (impressions are counted when the e-mail image is loaded) and module clicks are most commonly not registered by Raptor, the KPI set is intentionally narrower.
### Total module impressions
The total number of times any Raptor recommendation module has been rendered inside an e-mail during the selected period. It is the e-mail equivalent of the web "Module impressions" KPI and is the primary volume indicator for e-mail personalisation.
### Overview chart
The chart on the Email Personalisation has a bar/line toggle that changes the visualisation, and the module list on the left lets you compare individual e-mail recommendation modules.
### Glossary
| **Term** | **Meaning** |
| --- | --- |
| Raptor visit | A visit in which the user clicked at least one item inside a Raptor recommendation module. |
| Non-Raptor visit | A visit in which the user did not click any item in a Raptor recommendation module. |
| Module impression | One rendering of a recommendation module — counted whenever the Raptor API returns items. |
| Direct revenue | Revenue from a purchase where the bought product was clicked in a Raptor module within a 7 day period. |
| Assisted revenue | Revenue from a purchase that occurred after a Raptor click in the same session, but on a different product. |
| Organic revenue | Revenue from sessions where Raptor was shown but no recommendation was clicked. |
| Index | Performance ratio between the Raptor and Non-Raptor groups, where 100 = parity. |
### Tracking Stats
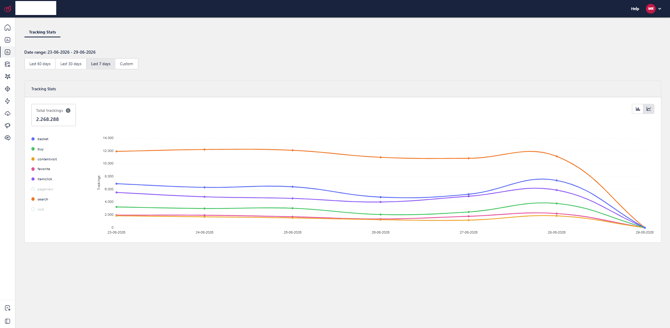
The Tacking Stats are used to see how many events of each type have been registered by Raptor during a time period. The events are implemented through the Raptor tracking script when this was set up on the account. The overview is mostly used to track if the tracking script has been fully operational, as any fall-outs will be immediately apparent here.
- [Welcome to Raptor](https://content.raptorservices.com/help-center/welcome-to-raptor?hsLang=en#main-content)
- [Introduction](https://content.raptorservices.com/help-center/welcome-to-raptor?hsLang=en#introduction)
- [Analytics & Insights](https://content.raptorservices.com/help-center/analytics-insights?hsLang=en)
- [Data Management](https://content.raptorservices.com/help-center/data-management?hsLang=en#main-content)
- [Implementing Tracking](https://content.raptorservices.com/help-center/data-management?hsLang=en#implementing-tracking)
- [Implementing Raptor Recommendation](https://content.raptorservices.com/help-center/data-management?hsLang=en#implementing-raptor-recommendation)
- [Email Marketing Integration](https://content.raptorservices.com/help-center/data-management?hsLang=en#email-marketing-integration)
- [The Data Manager](https://content.raptorservices.com/help-center/data-management?hsLang=en#the-data-manager)
- [Streaming API](https://content.raptorservices.com/help-center/data-management?hsLang=en#streaming-api)
- [Destinations](https://content.raptorservices.com/help-center/data-management?hsLang=en#destinations)
- [Customer Data Platform](https://content.raptorservices.com/help-center/customer-data-platform?hsLang=en#main-content)
- [Introduction](https://content.raptorservices.com/help-center/customer-data-platform?hsLang=en#introduction)
- [Profile Unification](https://content.raptorservices.com/help-center/customer-data-platform?hsLang=en#profile-unification)
- [Audience Builder](https://content.raptorservices.com/help-center/customer-data-platform?hsLang=en#audience-builder)
- [Audience Insights](https://content.raptorservices.com/help-center/customer-data-platform?hsLang=en#audience-insights)
- [Calculated Attributes](https://content.raptorservices.com/help-center/customer-data-platform?hsLang=en#calculated-attributes)
- [Activations](https://content.raptorservices.com/help-center/customer-data-platform?hsLang=en#activations)
- [Single Customer View](https://content.raptorservices.com/help-center/customer-data-platform?hsLang=en#single-customer-view)
- [CDP Export API](https://content.raptorservices.com/help-center/customer-data-platform?hsLang=en#cdp-export-api)
- [Website Recommendations](https://content.raptorservices.com/help-center/website-recommendations?hsLang=en#main-content)
- [Introduction](https://content.raptorservices.com/help-center/website-recommendations?hsLang=en#introduction)
- [Recommendation Strategies](https://content.raptorservices.com/help-center/website-recommendations?hsLang=en#recommendation-strategies)
- [Feeds](https://content.raptorservices.com/help-center/website-recommendations?hsLang=en#feeds)
- [Tuning Parameters](https://content.raptorservices.com/help-center/website-recommendations?hsLang=en#tuning-parameters)
- [Working with the Raptor API](https://content.raptorservices.com/help-center/website-recommendations?hsLang=en#working-with-the-raptor-api)
- [Mail Recommendations](https://content.raptorservices.com/help-center/mail-recommendations?hsLang=en)
- [E-mail Triggers](https://content.raptorservices.com/help-center/e-mail-triggers?hsLang=en#main-content)
- [Get started](https://content.raptorservices.com/help-center/e-mail-triggers?hsLang=en#get-started)
- [E-mail Trigger Documentation](https://content.raptorservices.com/help-center/e-mail-triggers?hsLang=en#e-mail-trigger-documentation)
- [E-mail trigger integrations](https://content.raptorservices.com/help-center/e-mail-triggers?hsLang=en#e-mail-trigger-integrations)
- [Site Search](https://content.raptorservices.com/help-center/site-search?hsLang=en#main-content)
- [Search Tracking](https://content.raptorservices.com/help-center/site-search?hsLang=en#search-tracking)
- [Introduction](https://content.raptorservices.com/help-center/site-search?hsLang=en#introduction)
- [Implementing Site Search](https://content.raptorservices.com/help-center/site-search?hsLang=en#implementing-site-search)
- [Search Ranking & Recommendations](https://content.raptorservices.com/help-center/site-search?hsLang=en#search-ranking-recommendations)
- [Reporting](https://content.raptorservices.com/help-center/site-search?hsLang=en#reporting)
- [Merchandising](https://content.raptorservices.com/help-center/merchandising?hsLang=en#main-content)
- [Introduction to Merchandising](https://content.raptorservices.com/help-center/merchandising?hsLang=en#introduction-to-merchandising)
- [Boosted Campaigns](https://content.raptorservices.com/help-center/merchandising?hsLang=en#boosted-campaigns)
- [Customized Feeds](https://content.raptorservices.com/help-center/merchandising?hsLang=en#customized-feeds)
- [AI Models](https://content.raptorservices.com/help-center/ai-models?hsLang=en#main-content)
- [Customer Lifetime Value](https://content.raptorservices.com/help-center/ai-models?hsLang=en#customer-lifetime-value)
- [Administration](https://content.raptorservices.com/help-center/administration?hsLang=en#main-content)
- [Trust Center](https://content.raptorservices.com/help-center/administration?hsLang=en#trust-center)
- [User Management](https://content.raptorservices.com/help-center/administration?hsLang=en#user-management)
- [Operational Insights](https://content.raptorservices.com/help-center/administration?hsLang=en#operational-insights)
- [Data Retention](https://content.raptorservices.com/help-center/administration?hsLang=en#data-retention)
[](https://www.raptorservices.com/)
raptorsmartadvisor.com Help Center
Copyright © 2026, Raptor Services A/S