
If a vendor does not perform, you need to easily be able to see it, so you can make adjustments.
Similarly, if the vendor is performing great, you need to know where you can invest more to further increase performance.
At Raptor we look at it like this – If our clients decided to turn off Raptor, how much would it impact their performance? We aim to showcase this by measuring the effect of personalization by comparing users who engage with a personalization module to users who do not.
This comparison allows you to see what difference personalization software has on the users who engage with it as opposed to users who do not engage with it.
Personalization measurement metrics
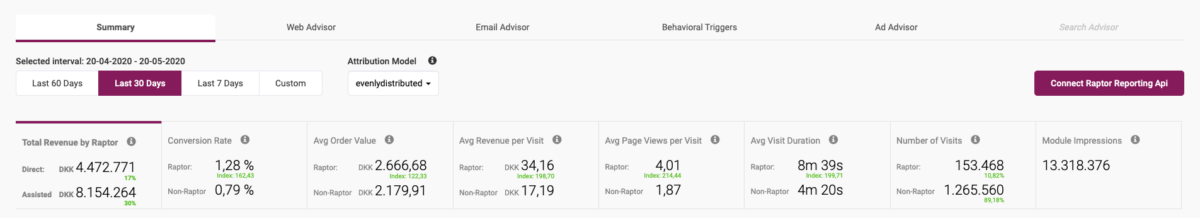
We use selected metrics to showcase the value that we generate for our clients. These metrics are used to evaluate the current setup by providing insights for optimization and adjustment.
- Total Revenue, Direct and Assisted
- Conversion Rate
- Average Order Value
- Average Revenue per Visit
- Average Page Views per Visit
- Average Visit Duration
Read more: Bog & Idé – More Inside – Case Study
Personalization measurement metrics
We use selected metrics to showcase the value that we generate for our clients. These metrics are used to evaluate the current setup by providing insights for optimization and adjustment.
- Total Revenue, Direct and Assisted
- Conversion Rate
- Average Order Value
- Average Revenue per Visit
- Average Page Views per Visit
- Average Visit Duration
Direct and assisted
We divide our revenue metric into two categories, Direct and Assisted. We divide this metric into two categories because it is important to know when a click on a product in the recommendation module is the direct reason why a user has purchased a product and when a click on a product in a recommendation module has assisted the purchase.
Direct
The direct metrics shows the sum of all sales where users have clicked on a product in a Raptor recommendation module and bought that exact product.
Assisted
The assisted metrics shows the sum of all sales where users has clicked on a product in a Raptor recommendation module and bought a different product.
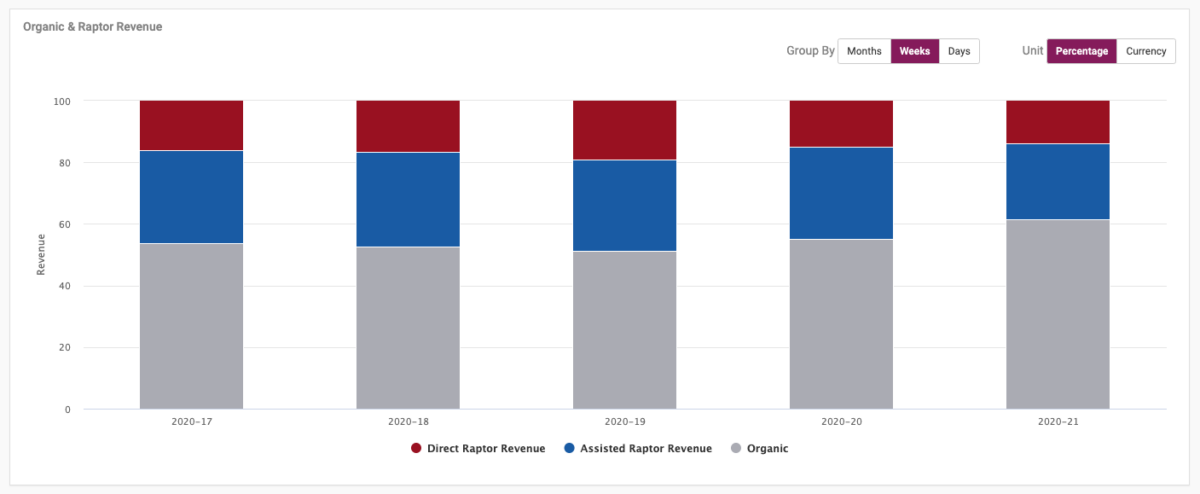
Total Revenue
The direct part of the metric is a clear indication that a relevant product in a recommendation module was the reason why a user chose to buy the given product. On average, we see that 10-15% of our client’s total revenue is directly generated from recommendation modules.
The assisted part of the metric is an indication of how personalization modules assist in a purchase. Even though the purchased product is not directly found in a recommendation module, the module received a click and was a part of the purchase journey. On average, we see that 35-40% of our client’s total revenue is assisted by recommendation modules.
Conversion Rate
The conversion rate shows the difference it makes to have recommendation modules on a website. When you look at the Raptor conversion rate compared to the Non-Raptor conversion rate, the users who engage with personalization through recommendation modules are more likely to complete a purchase than a user who does not.
When analyzing the conversion rate on all of our clients across different industries, we can see that the average conversion rate is 130.8% higher with Raptor compared to the Non-Raptor conversion rate.
130.8%
Average Order Value
The Average Order Value metric shows the average amount spent by customers on each online purchase made. It is easy to see if users who engage with personalized recommendations are affected by it when comparing Raptor users to Non-Raptor users.
The average order value shows how good Raptor is at creating cross and up-selling, but doesn’t consider conversions, and therefore it cannot replace the conversion rate.
It is clear to see, that users who engage with personalization are more likely to convert, and they have a higher average order value. We typically see that Average Order Value is 15-20% higher for customers who engage with Raptor recommendations, compared to customers who do not.
15.1%
Average Revenue Per Visit
The average revenue per visit is a measurement of the amount of money generated each time a customer visits your website.
If the RPV is positive, you are earning money on your personalization investment. You can have a lower average order value, while still maintaining a positive RPV if the conversion rate is correspondingly high.
The RPV covers the blind spots from both the conversion rate and the average order value metrics. You might have a high conversion rate, but if your average order value is very low, your high conversion rate will not generate much revenue. The Average Revenue per Visit metric shows how good you are at converting visitors to customers, while also looking at the amount of revenue generated.
Therefore, the RPV gives you the best picture of the current state of your Raptor solution. When analyzing our client’s RPV across different industries we see a difference in the performance of 168.3% when comparing Raptor users and Non-Raptor users.
168.3%
Average Page Views Per Visit and Average Visit Duration
The metrics Average Page Views per Visit and Average Visit Duration show how many pages your unique visitors view on average during a session, and how long they stay on your site on average.
These metrics are a good indication of how well engage your visitors during their stay on your website/while they visit your website.
When you implement personalization, it adds a lot of benefits that you can directly link to revenue. When the recommendations that the individual users see are relevant, they tend to stay longer on your site. Average Page Views and Average Session Duration are both important KPI’s when working with search engine optimization (SEO). When your content- and product recommendations create value, you will experience that your customers will visit more pages and stay longer, which is indicators to Google that the content is relevant, and they will rank it higher in the search results.
Like the other metrics, we differentiate between Raptor and Non-Raptor users to illustrate if there are differences in the performance of users who engage with personalization and users who do not.
When it comes to the metric, Average Page Views per Visit, our analysis shows that users that engage with Raptor view 154.1% more pages per visit than users who do not click on Raptor-recommendations. This correlates to the average visit duration, which is 80.9% higher for Raptor users.
Key takeaways
It is critical that you can measure the performance of your vendors, so you can track if it is worth the investment. This can be done by illustrating the difference that personalization has on users who engage with recommendations compared to users who do not.
We illustrate the value and effect of personalization through different business critic KPI’s, which makes it easy for our clients to see what metrics are affected by personalization across all of their digital channels and how much they would loose, if they choose to remove personalization from their website.
Related Content
You might also like

Do you transform your Black Friday encounters into lasting relationships? Or do you let this annual...
Learn More
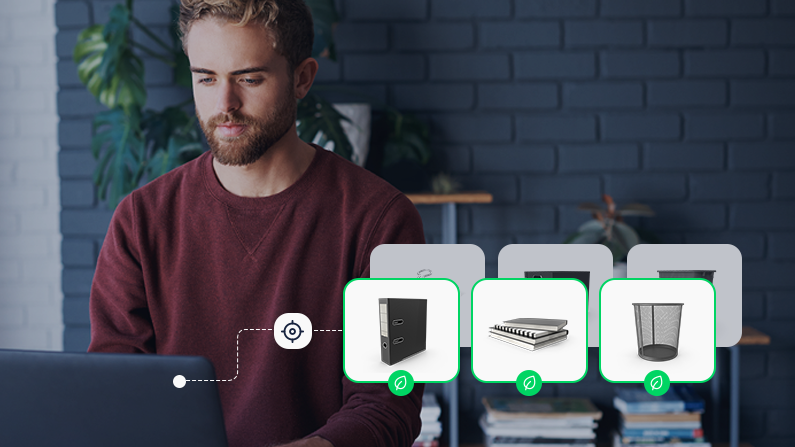
Sustainability and e-commerce. To many, they’re considered close to mutually exclusive. But they...
Learn More

If you're familiar with price drop triggers, you already know how effective they are at converting...
Learn More

It’s a common myth that B2B Salesdon’treally need a proper digital setup. After all, “people buy...
Learn More

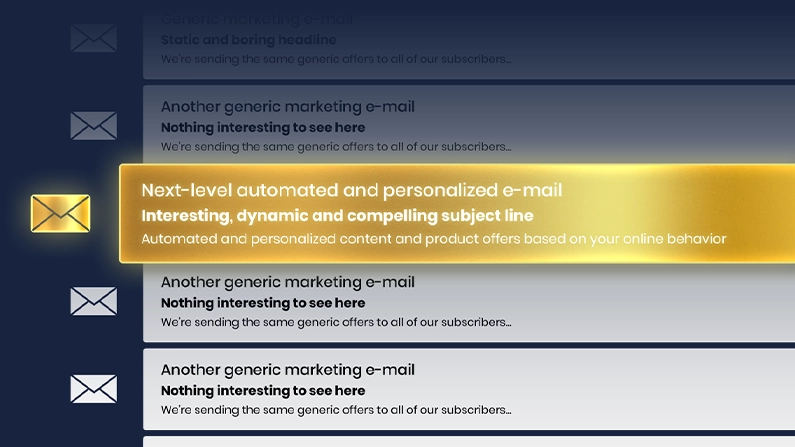
If you’re a seasoned e-mail marketer, you might think you know everything you need to know about...
Learn More

Is this how you create newsletters too? If you work in e-commerce, you might recognize this routine:
Learn More
No reason to sugarcoat it. E-commerce is facing a lot of challenges right now. Chinese giants like...
Learn More

It’s a name that’s impossible to ignore. No matter how hard you try. TEMU. The Chinese giant has...
Learn More

E-mail marketing is an important way to stay in touch with your customers. But it can also be a...
Learn More
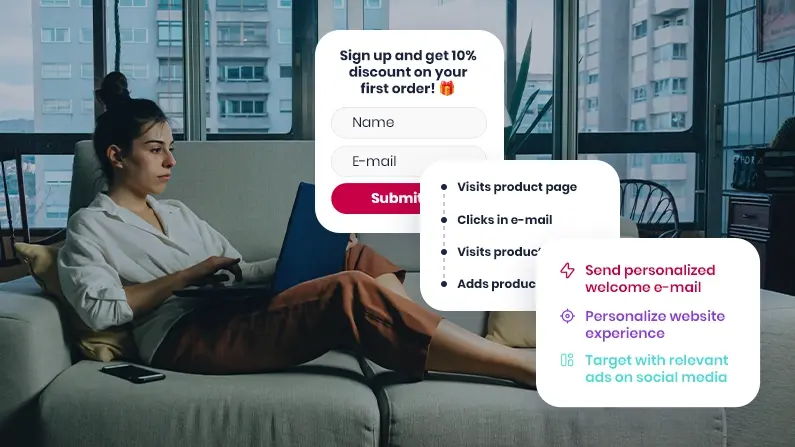
Are you looking to take your e-mail marketing to the next level and increase conversion rates? Then...
Learn More
Let us show you what you can achieve with premium personalization


A Raptor expert can share more about the product and answer any questions you have.