With Audience Insights you get valuable data about the people represented in your CDP. The metrics you see in the Audience Insights are based on the Customer Lifetime Value (CLV) model - an AI Model by Raptor. You can see how to set up the CLV model here. You access the Audience Insights from a separate tab when opening the Audience Builder.
%201.png?width=688&height=331&name=Audience%20Insights%20(New)%201.png)
Both the CLV model and the Audience Insights are included in the CDP license at Raptor.
Introduction
Once a CLV model is set up, a series of values are calculated each day for each of your customers, e.g. historic value, future value, lifetime value and predicted number of orders next year. You can actively segment your audiences based on these values in the Audience Builder, and with the Audience Insights you can see how your audience perform compared to the rest of the people in the CDP.
How to access Audience Insights
1. Go to Raptor Control Panel and sign in
2. Open the menu and click "Audience Builder"
3. Click an existing Audience or create a new
4. Click the tab "Audience Insights"
5. Select the CLV model you would like Audience Insights to be build on and click "Apply"
The system now builds the Audience Insights view. Note: You might be asked to refresh the audience before the Audience Insights view can be shown. In that case, press "Refresh" in the Audience Builder tab.
Also, if the "In total population" values are displaying zeros (which might happen the first time you open the Audience Insights using a freshly built CLV model), you can press the "Refresh values" button in the upper right corner. This will force calculation of the totals through the system rather than awaiting the usual scheduled update (once a day).
What the numbers of Audience Insights mean?
Following walkthrough of each of the sections in the Audience Insights aims at introducing you to the details of the metrics and clear up the questions you might have. In the Audience Insights you will also find information about the metrics by hovering over the little "i" icons.
🔍In this article - and in the Audience Insights in general - we make the assumption that the outcome of the CLV model is monetary values calculated from your customers' purchase history (often a buy or order event).
General Information
The General information box will show important information about the data set that the chosen CLV model is built upon. When using the buy or order event for building the CLV model, the data set consists of people in the CDP who have made at least one purchase. 
First transaction date is the date when the first purchase in the total population was made, and last transaction date is the date when the latest purchase was made. Both dates take the selected CLV model into account.
Last updated will tell you when the Audience Insights numbers were last calculated. CLV models are calculated once every day, whereas the numbers for Audience Insights are calculated on the same schedule as the audience itself. This means that you can experience small deviations in the number of people in the audience and the number of people displayed in the Audience Insights view, because people can have entered or left a specific audience, but are still not present in the CLV model. You can always manually recalculate the Audience Insights numbers by pressing "Refresh" in the Audience Builder tab. Doing that will force an update of the Audience Insights calculations and update the date and time in the General Information box.
Number of customers
The Number of customers box will tell you how many people in the audience and in the total population are represented in the selected CLV model.
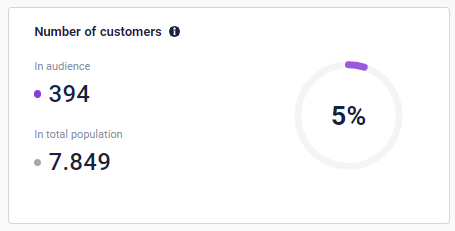
Depending on which parameters you defined the selected audience from, the number of customers in audience will only show a subset of people from the audience - thus the subset that is represented in the selected CLV model. For example: an audience can contain both people who only visited your site and people who bought. If your CLV model is built on data from a buy/order event, only the people who actually bought are represented in the CLV model and thereby in the Audience Insights.
The number of customers in total population will always show the total number of people in your CDP who is represented in the selected CLV model. That way you will always have a constant reliable basis of comparison.
🔍A person is defined as a profile recognized by Raptor as a Raptor Unified Profile or RUP.
Customer retention rate
The customer retention rate shows the the percentage of customers in the selected audience who have placed an order at least twice. The number is compared to the same number in the total population.
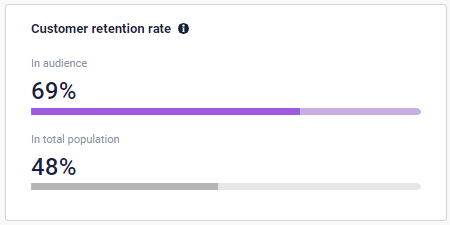
If you would like to measure the retention rate among your customers over the last 365 days, simply build an audience of people who bought at least once within the last 365 days and see the retention rate in Audience Insights. In this case, 69 % of all buying customers in the audience have bought at least two times. By hovering over the graphs, you will see additional information.
Customer Lifetime Value
Customer Lifetime Value (CLV) is the sum of historic value and predicted future value the next 365 days.
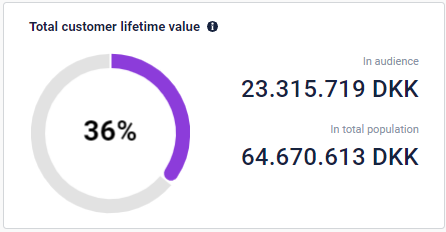
In this box, you will be able to see how much the people in your audience and the people in your total population are worth in total when combining historic and future value. Historic value is limited to the date of the first transaction and predicted future value is limited to 365 days. By hovering over the numbers you can see the split between historic and future value.
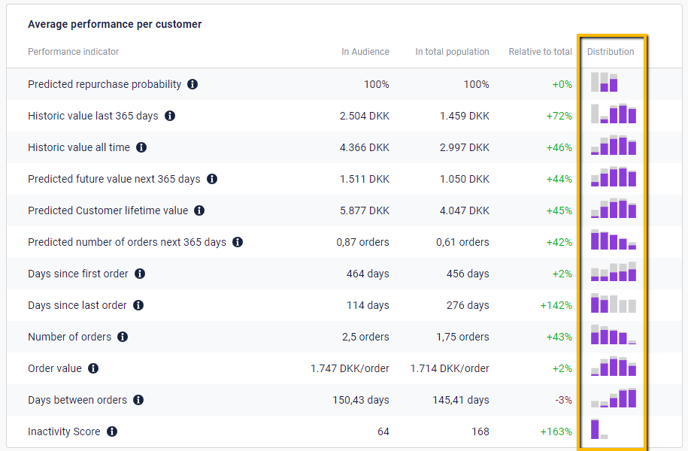
Average performance per customer
In the Average performance per customer box you will see all metrics generated by the CLV model as an average per customer in the selected audience and be able to compare them with the average for the total amount of people who are represented in the selected CLV model. Use the relative percentage to the right to evaluate how your audience performs and how they stand out in comparison to all of your customers
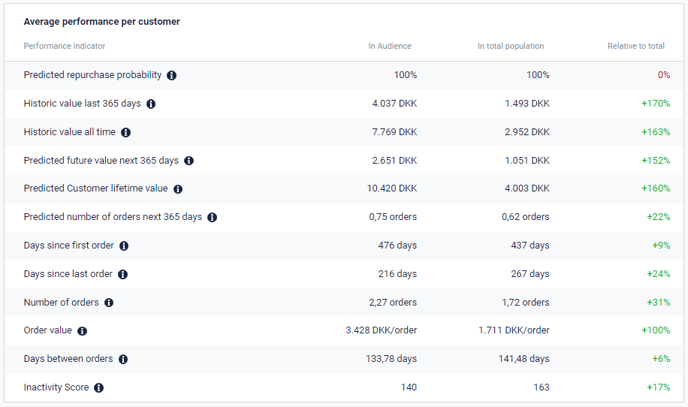
What each of the metrics means:
- Predicted repurchase probability: Predicted repurchase probability represents the average probability of the customers in the audience placing a new order at any time in the future. It is the opposite of churn, but churn can be calculated on the basis of predicted repurchase probability with this formula: Churn = 100 - 'Predicted repurchase probability'.
Predicted repurchase probability is a prediction by the AI model. It is based on the number of orders (Frequency), days since last order (Recency), days since first order (Time), the personal "average days between orders" for the customer and the drop out rate for the shop. The drop out rate is shop specific and represents the ability to keep customers coming back.
For example: If a customer has a predicted alive percentage of 75, her churn risk is 25 %. - Historic value last 365 days: The average sum of the value of all orders by the customers in the audience during the last 365 days.
- Historic value all time: The average sum of the value of all orders placed by the customers in the audience.
- Predicted future value next 365 days: The predicted average value of the customer the next 365 days. It is based on predicted number of orders next 365 days and average order value.
- Predicted Customer Lifetime Value: The average sum of historic value and future value the next 365 days for the customers in the audience.
- Predicted number of orders next 365 days: This is a prediction by the AI model and tells you how many times on average a customer in the audience will place an order within the next 365 days. It is based on the customers' buy frequency and the predicted alive score.
- Days since first order: Average number of days since the first order by the customers in the audience.
- Days since last order: Also known as recency. Average number of days since the last order by the customers in the audience.
- Number of orders: Also known as frequency. The average number of orders the customers in the audience have placed. Multiple items bought on the same day are aggregated into one order.
- Order value: Also known as monetary value. The average value of the basket. It is equal to the average total historic value for the customers in the audience divided by the number of orders the customers have placed. Multiple items bought on the same day are aggregated into one order.
- Days between orders: Is the number of days between the first and last order divided by number of orders on average per customer in the audience. This number is calculated solely on data from people who have placed at least 2 orders.
For example: 3 orders in 100 days (first order on day 0, last order on day 100) equals 50 days between orders on average. - Inactivity score: Days since the customer placed her last order divided by the average days between orders for that customer. On the day a customer places an order, this score will be 0. Until the same customer buys again and has not reached her personal buying average, the inactivity score will be between 0 and 100. If she exceeds her personal buying average, the number will be more than 100.
For example: If a customer places an order every 10 days in average, but today it is 15 days since she placed her last order, the inactivity score will be 150.
Metric details view
Each of the metrics above can be clicked to open a detailed overview. This will show you how people of the audience are distributed across the values of the individual metric, rather than only relying on the average values. The small graph to the right, gives you a quick impressions of the actual distribution of your customers in the given metric, where the purple bars represent customers of the audience, and the grey bars represent the total population.
Clicking a metric will open the details view. In the screenshot below, "Historic value all time" is shown.

In the table to the right, customers of the audience are divided into seven fractions going from the worst performing to the best performing and their corresponding values. This way, you can see the value that corresponds to e.g. your 10 % best performing customers in the audience and target them with a campaign. Likewise, you can see the value of the one customer with the lowest value and the one with the highest value. NOTE: If the "Max" value seems suspiciously high, it could point towards flawed data imported into the CDP, which could call for additional formatting or filtering of the dataflow that imports the given values.
In the graph to the left, the value of the metric is divided into 50 buckets on the horizontal axis and number of customers in the audience (purple bars) and in the total population (grey bars) who have values corresponding to the buckets up the vertical axis. By hovering over each bar, you will see how many customers are placed in the bucket (written in bold) and how many customers have values below and above the value of the bucket.
🔍The scales are logarithmic to create graphs that visually represent the distribution in the best possible way.
Customers segmented by lifetime value and predicted repurchase probability
The matrix in the lower right corner shows distribution of the customers in the audience in nine groups. The groups are based on how likely the customers are to buy in your shop again in the future (predicted repurchase probability) and their lifetime value (CLV).
%202.png?width=688&height=443&name=Audience%20Insights%20(New)%202.png)
What the colors of the matrix mean
The matrix will reveal how your customers distribute from high value to low value, and from loyal to churned. Often, you will see that a relatively low amount of customers generates a relatively high percentage of the revenue. You can build audiences from any of the squares which enables you to target for instance your most loyal and valuable customers. Read this article to find examples.
The vertical axis divides the customers of the audience into the 20 % with highest CLV, the 30 % with medium CLV, and the 50 % with the lowest CLV and splits the value accordingly.
The horizontal axis divides the customers of the audience into three groups based on the likelihood of placing an order any time in the future; The lowest 20%, the middle 60% and the highest 20%. At the top, you will be able to see which probability to repurchase each of these groupings entail - this can vary greatly depending on the type of business.
Green: Customers placed in the green column buy frequently and are considered loyal, being in the top 20% in terms of how likely they are to buy from you again in the future. How frequently they buy is individual per customer. When customers start to exceed their personal buying average, they will become less loyal.
Yellow: Customers placed in the yellow fields are people with potential to be loyal. They make up the largest segment, and are often transitioning - either from the green group towards the red or from the red towards the green. Either way, there is great potential in reaching out to this group with personalized offers.
Red: Customers placed in the red column are considered in high risk of churning. They have exceeded their buying averages substantially. It might still be valuable to reach out to this group as they have already bought and know your brand. By hovering over each square, you can see the CLV per customer in the group. Use this to consider how much a targeted anti-churn campaign is worth compared to the potential value and compared to the cost of new customer acquisition.
When new customers buy in your shop, they will get the average loyalty level of the shop.
Build new audiences directly from the matrix
Whn hovering over the colored squared of the matrix, you will see the "Build new audience" button. Clicking the button will create a copy of the audience you are looking at, but with added filters narrowing down the Customer Lifetime Value and the Predicted Repurchase Probability to match exactly the profiles in the selected colored square. The name of the new audience will be: the name of the original audience + CLV Level x Predicted Repurchase Probability percentage + timestamp (e.g. All Customers Medium CLV x Loyal 25-06-2024 11:32). You can change the name and the tags of the new audience and adjust the filters' values.
Using this tool will give you an excellent way of targeting your most loyal customers for loyalty programs, or your high value churners with recovery campaigns.
You might find small differences in the number of people in the newly created audience compared to the number of people in the selected square of the original audience. This is a matter of timing, as the CLV model recalculates once a day, while an audience can be calculated manually at any time. This will equal out as soon as the CLV model is recalculated.
🔍If an audience is built upon one or both of the CLV Model metrics "Predicted Customer Lifetime Value" and "Predicted Alive (%)", and you use the auto-build feature, you need to be aware that there is a risk of creating conflicting conditions. It will often make better sense to adjust the existing parameters than adding the same parameters multiple times.
FAQ
Q: How does limitation of an audience impact the metrics in the Audience Insights view?
A: Often, you would like to limit your audience. This could be because you want to focus on people considered active customers having bought within e.g. the last six months.
Now, you focus on a subset of people in your total population. The values in the Audience Insights view are not affected by the time limit of the audience, meaning that a customer's lasting values like Historic value all time, Number of orders and Customer lifetime value are not capped at the time limit set in the Audience Builder.
You will see the distribution and values in the matrix in the lower right corner change, as an increased recency (time since last purchase) will impact your churn risk positively.