When running Boosted Merchandising Campaigns, a detailed reporting view is available allowing you to examine the effect of your campaigns.
This article will take you through the metrics and features of the reporting view. It's up to you to decide which metrics are valuable to you and your stakeholders when creating an overview of your campaigns.
🔍 Note: Site Search and Merchandising Reporting
Go to Merchandising -> Boosted Campaigns -> Click the "Reporting"-button on an active or a finished campaign to open the Merchandising Reporting.
Campaign summary
You'll find a summary of the campaign in the six boxes in the upper left corner:

Total campaign revenue: The total direct revenue attributed directly to the campaign by products featured in the campaign. Also see the Revenue Attribution box below.
Campaign revenue index: The average revenue per day of the products in the campaign in a seven day baseline period leading up to the campaign period is index 100. The Campaign Revenue Index is the average revenue per day in the campaign period compared to the baseline index. A Campaign Revenue Index of 139 means that revenue during the campaign was 39 % higher than in the baseline period.
Selected products: An overview of which products are featured in the campaign. If products are selected by a query, it will simple state "Query selection".
Selected modules: An overview of which recommendation modules the campaign is applied to. Hover the i-icon to see which modules.
Attached audiences: An overview of which audiences the campaign is targeting, if any.
Boosting level: The boosting level (Low, Medium, High) of the campaign.
👀Revenue attribution
Campaign attribution is a central concept when measuring the effect of a campaign. For the Merchandising reporting we have made a simple attribution model that only takes direct campaign revenue into account. The model applies to campaign revenue and number of purchases.
Attribution model:
When a customer clicks on a product in a recommendation module and the product plus the module are featured in a merchandising campaign, and the customer buys the same product within seven days, the purchase and the revenue is attributed to the campaign.
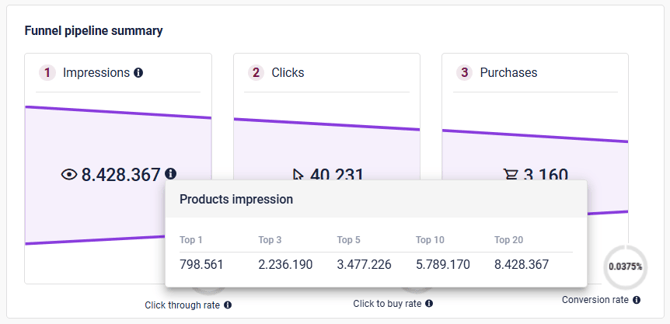
Funnel summary
In the top right corner, you'll see a funnel representing the journey from impressions to clicks and purchases including how these relate to each other.

Impressions: The number of impressions in top 20 module placements. Impressions are calculated by an approximation based on the API call to the recommendation API and the rank of each product featured in a campaign. Impressions are available in five buckets throughout the reporting: top 20, top 10, top 5, top 3, and top 1. The buckets allow you to make an assessment of which bucket is representing your product display the best. By hovering the eye-ikon you can see the distribution of impressions based on the buckets.
The number of impressions in e.g. the top 5 bucket will tell you how many times a product featured in the campaign was ranked 1 through 5 when the API response returned its results. If most of your traffic comes from mobile, it might be most reasonable to look only at impressions in the top 3 or even top 1 bucket.
🔍Note: Collection of impression data started on December 16, 2024. Impression reporting on campaigns started before this date might be incomplete.
Clicks: The number of times a product featured in the campaign was clicked in a recommendation module running the campaign.
Purchases: Number of times a product featured in the campaign was purchased within seven days from being clicked. Also see the Revenue attribution box above.
Click-through rate (CTR): Number of clicks on a product in the campaign divided by number of impressions. Impressions will by default be counted for top 20 module placements. This is important when analyzing the CTR. Consider calculating the conversion rate based on the best suitable bucket.
Click-to-buy rate: Number of purchases divided by number of clicks. This tells you how often a product in the campaign was purchased within seven days after being clicked on in a recommendation module.
Conversion rate: Number of purchases divided by number of impressions. Impressions will by default be counted for top 20 module placements. This is important when analyzing the conversion rate. Consider calculating the conversion rate based on the best suitable bucket.
Purchases contribution: The purchase contribution percentage will show how many of the total purchases of the products in the campaign can be attributed to the campaign.
Campaign effect
In the middle you will be able to compare performance during the campaign with a baseline period prior to the campaign.

Baseline/Campaign Comparison
The purpose of the baseline is to give you a tool to prove the effect of your Merchandising campaigns.
Numbers for building the baseline graph are collected from the day your Merchandising license is activated - June 1st 2024 (for revenue and purchase data) or December 16 2024 (for impression data), however, being the earliest date for existing customers. With the baseline, you can freely select a period of time you want to compare the performance of the campaign with. The baseline consists of either number of purchases, number of impressions or revenue of the products that have been selected for the campaign. You can freely select the baseline period prior to the campaign back from the day data collection started.
💡Select a suitable baseline period that allows for a reasonable comparison. You should select a baseline period that holds approximately the same set of products that are in the campaign.
As a default, numbers are displayed in days. For long running campaigns, you can also switch to displaying performance by week or by month.
🔍Note on Campaign vs. Organic: For all three metrics you will see an organic part (purple) and a campaign part (green) in the campaign period on the right hand side. In general, this will show you revenue, purchases and impressions that are attributed to the campaign and the ones that are not attributed to the campaign.
Revenue and purchases: When a purchase of a product in the campaign is made by a customer who clicked on the same product in a recommendation module that is featured in the campaign, the purchase and the revenue is attributed to the campaign and will be part of the green bar. All other purchases of products featured in the campaign count as organic and are displayed in the purple part of the bar.
Impressions: We only know impressions called through the Raptor recommendation API. This means that campaign-attributed impressions (green part of the bar) are products called through recommendation modules featured in the campaign. Organic impressions (purple part of the bar) are impressions of the products featured in the campaign, where the module is not part of the campaign.
Performance by modules
In the tab "Performance by modules" you will be able to see how revenue, clicks and purchases distribute between the modules of the campaign.

Performance is divided into organic revenue/clicks/purchases (purple color) and campaign revenue/clicks/purchases (green color). Campaign revenue/clicks/purchases will tell you the direct performance of the products featured in the campaign, and organic revenue/clicks/purchases will show you performance of products that are displayed in the module(s) but are not part of the campaign.
Reporting by product
In the bottom of the reporting you will see performance numbers per product:

Here, the top 100 products of the campaign sorted by revenue are displayed. If the campaign contain more than 100 products, you can use the search bar to find the ones that are not represented in the list. You can search for either product ID or product name.
The list consists of the following information:
ID: The product ID (often SKU number)
Name: Name of the product
Impressions: Tells how many times the product was displayed in one of the top 20 placements in one of the recommendation modules that are featured in the campaign. By hovering the magnifier-icon you can also see how many times the product was displayed in top 10, top 5, top 3 and top 1 placements of the recommendation modules. The placement of the product is measured by it's placement when the Raptor API was called.
Clicks: Number of clicks on the product during the campaign in modules that are part of the campaign
Purchases: Number of times the product was purchased during the campaign (please note that quantity can be handled differently depending on how tracking data streams into Raptor. In general quantity is not taken into account, meaning that a purchase can consist of multiple pieces of the same product)
Click to buy rate: Number of times the product was purchased divided by the number of clicks
Revenue: The revenue the product has generated during the campaign (here, the subtotal of the orderline is summed taking quantity into account)
By clicking the column headline in the table, you can sort the products according to the respective metric, e.g. number of clicks or number of purchases.
Changes in the campaign
A product can go in and out of stock also during a campaign period. This is taken into account in the reporting, and data will be collected even if a product was out of stock when the campaign started. Clearly, a product that is out of stock, will not be recommended and thus no data will be collected.
If you add products to a campaign or if you change the query the campaign is based on during the campaign period, performance for new products entering the campaign will be collected throughout the entire campaign period and will be attributed to the campaign. This is helpful if you during the campaign period decide to include more products in the campaign and still want to utilize the full set of reporting metrics for the added products.
If you remove products from the campaign during the campaign period, the data already collected will still be present in the reporting, and so will future data, as a product will not be removed from the reporting. The product will stop being boosted since it is no longer part of the campaign, so it is unlikely that it will generate data after being removed.
We recommend, however, always to make a new campaign, if you need to change the selected product set or the query during the campaign period. This will keep the reporting clean. If you need to change a campaign, we strongly recommend you to end the running campaign and start a new. Use the "Use as template" functionality to create a new campaign that contains the same settings as the existing.
Q&A
Q: How often are the numbers of the Merchandising Reporting updated?
A: The numbers in the reporting view are updated once every hour. When a campaign has ended, you can see all figures after an hour. Be aware that purchases and revenue are attributed to a campaign up to seven days after the user has clicked a product. See revenue attribution information box above for general notes on revenue attribution
Q: In which kind of campaigns is the Reporting applicable?
A: Reporting is applicable for Boosted Campaigns
Q: If a product is featured in multiple campaigns at the same time will revenue and purchases then be attributed to all campaigns?
A: Yes. The product metrics will count in all campaigns.