The Single Customer View offers a window display of all CDP data collected or calculated on each of your customers. This view will put a face on the CDP by showcasing information on an individual level.
Use the Single Customer View to create a picture of a typical customer within a specific audience. You will get a clear idea of the customer journey and the value an individual brings to your business. You can validate your audiences by looking up members and checking if they match your audience definition.
This article will introduce the Single Customer View, its settings, and the information you will encounter about your CDP customers.
How to set up Single Customer View
When logging into the Control Panel, you will find the Single Customer View in the menu under the Customer Data Platform.
The first time you enter, you will need to set up which interaction events to display in the interaction timeline. If this is already set up, you will see the search view.
Press the Start set up-button

Select up to five interactions (these are your interaction schemas defined in the Data Manager) that you want to have available in the interaction timeline. You can change your choice at any time. Select interactions that represent what is most important to your business, i.e. which information would help you get a clear picture of a customer's journey within your ecosystem.

Press Save
Search for a customer
Now the search view will open. Search for a customer by typing any person identifier. This would typically be an email address, a phone number, or a customer ID from your customer club. Person identifiers are defined during the implementation of the CDP.
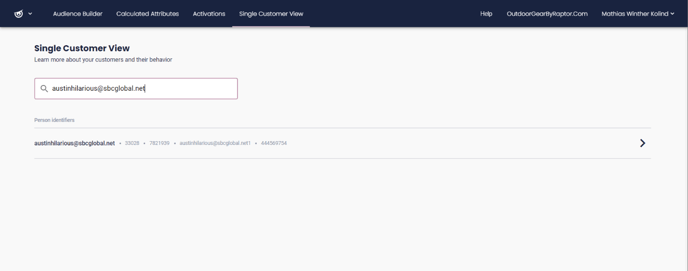
🔍You must write the full identifier in order to search. An incremental search will be added in a later update.
Press a person to open the Single Customer View
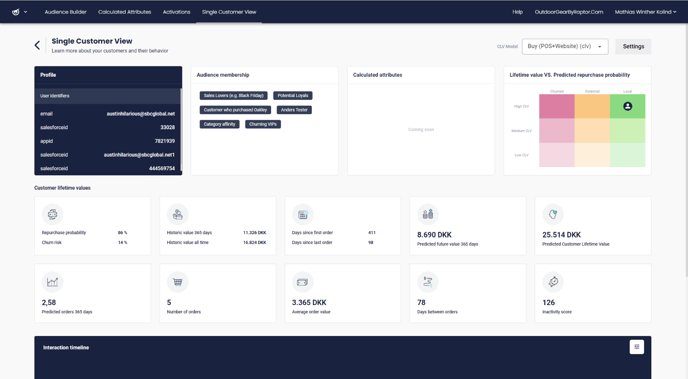
Profile Information, Audience Membership, and Calculated Attributes
In the top left you will see the Profile box displaying the person identifiers registered on the customer. Cookie IDs are excluded to minimize the list.
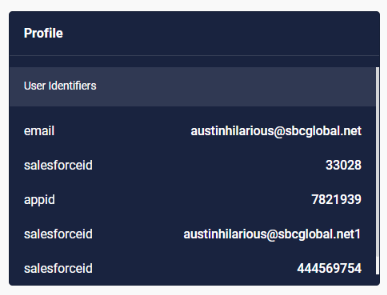
💡In a later update you will be able to select the personal information you have ingested into the CDP. This could be name, address, country, gender, etc.
In the second box, Audience membership, you will see which audiences the customer is a member of. Audiences must be activated in order to figure on the list. Clicking an audience name will bring you to the Audience Builder where the audience is defined. This is helpful if you did not create an audience yourself, or it will refresh your memory and ultimately help you understand the customer better.
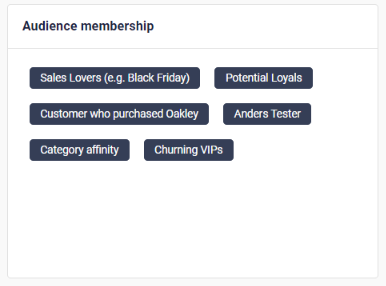
The third box will display the customers' values of your calculated attributes. These will be available at a later update.
Metrics of the Customer Lifetime Value Model
In the top right box, you will see the CLV vs. Loyalty matrix, also known from the Audience Insights. This will tell you how valuable the customer is and if the customer is loyal or if he/she is churning compared to your full customer base. The matrix displays values and customer position based on the selected CLV Model (if multiple CLV Models are configured on the account, you can switch between them in the dropdown in the top right corner).
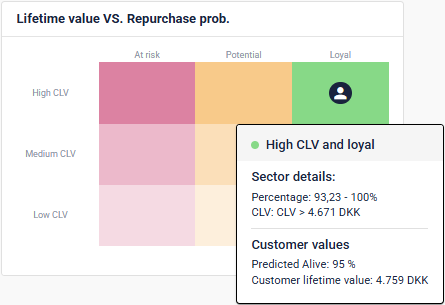
By hovering the cursor on the user icon or any of the colored sectors, you will see general details of the sector and specific details on the customer. Use the matrix to understand how loyal and valuable the customer is compared to all of your customers.
The mid-section of the Single Customer View displays all metrics of the selected CLV Model.
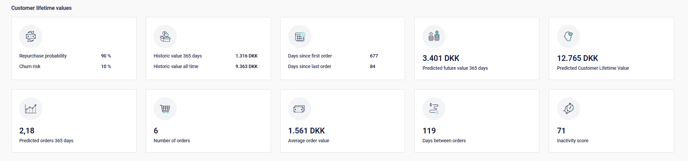
The metrics will offer you both historic values and future values on the customer predicted by the CLV Model. You will recognize the metrics from Audience Builder and Audience Insights, displaying e.g. the predicted number of orders the next year, total lifetime value, likelihood of churning, number of expected orders the next year, days since the last order, and more. See the full list of metrics and a thorough explanation of each in this article.
Interaction Timeline
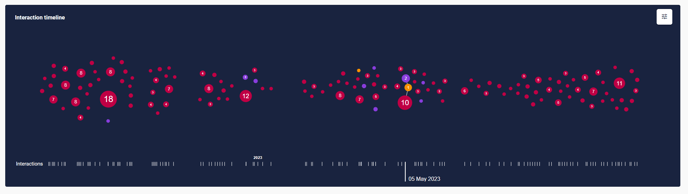
The vision of the timeline is to create a map of the customer journey and display it in a way that will inspire you to dive deeper into the metrics to understand the customer better. The Interaction Timeline displays interactions or touchpoints of the customer throughout the entire time data are available in the CDP.
When setting up the Single Customer View you will be able to select up to five interactions you want to display in the timeline. You can change the events any time under Settings in the top right corner.
You can toggle on and off interactions by clicking the icon in the top right corner of the timeline and clicking the interactions in the colored boxes. Here, you can also see the total number of each interaction. Use this option to filter away interactions that might blur the information that you are actually looking for. 
Hovering the bubbles will highlight the specific interaction and you will see the date and time in the bottom of the view. If the customer has performed an interaction multiple times on the same day, these will be grouped and the number of times is stated in the bubble. Hovering it will give you the date and the time interval from the first interaction and the last.
By hovering the small ticks in the bottom of the timeline, a white line will appear between different event bubbles that all happened on the same day. In the case below, the customer has visited 7 products on the website, added 2 products to the basket, and placed 1 order on March 29 2023.
 The use cases for the timeline is of course very dependent on the interaction data available in your CDP. A scenario that illustrates a full circle of events revolving around customers placing orders could look like this:
- Mail click
- Product view
- Add to basket
- Buy
- Return
Can you see a pattern between how often customers click your newsletter, how many products they view, how many products they put in the basket, and ultimately how many times they place an order? And will that journey justify the number of returns registered?
By illustrating this in a timeline it will be transparent if your customers have a tendency to often add items to the basket but seldom buy, or if they are clicking a lot in your newsletter or visiting your website often without the final conversion happening.
Q&A
Q: All boxes that are supposed to show output from a CLV Model are blank. Why is that?
A: The most likely reason is that the person that you have looked up is not represented in the selected CLV Model. If the CLV Model is based on online purchases and the person has not bought anything online, he/she will not be present in the model. Change the CLV Model in the drop-down in the top right corner, or create a new CLV Model: Open the top menu -> click "Customer Lifetime Value model" under AI Models
Q: Why does it take some time for the Interaction Timeline to load?
A: Fetching data on an individual customer among potentially millions and millions of data rows is a time-consuming matter. You will experience that it can take up to two minutes (typically it will take between 5 and 30 seconds) for the timeline to load. The speed depends on the total number of interactions stored in your CDP.